Telemetry Configuration
Telemetry lets you observe routes after they are deployed. Fluxify workers can send logs, traces, and metrics to the destinations configured for a project.
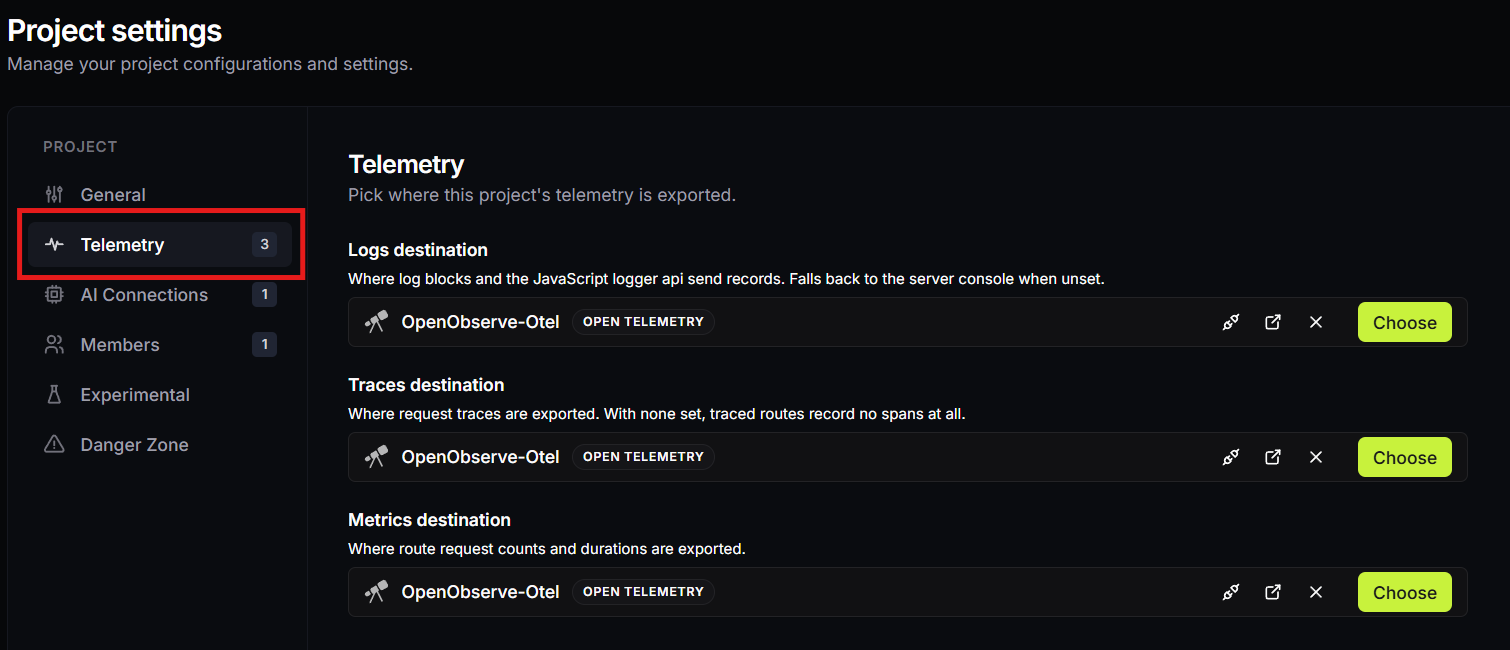
Open Project settings → Telemetry to choose an observability integration for each signal.
Configure each signal
| Signal | What it tells you | When it is sent |
|---|---|---|
| Logs | Messages written by logging blocks and the JavaScript logger API. | When a route emits a log entry. |
| Traces | The work performed during a route run, useful for following latency and failures. | Only for routes where tracing is enabled. |
| Metrics | Route request counts and durations. | Alongside recorded traced runs. |
You can use a different destination for each signal, or leave a signal unset. When no logs destination is selected, logs fall back to the server console. When traces or metrics are unset, Fluxify does not export them.
Tracing and cost
Tracing is enabled per route because detailed execution data has a cost. Enable it for routes you are investigating or monitoring closely, rather than treating it as a default for every high-volume endpoint.
Workers publish telemetry away from the request path, so exporting it does not make the caller wait for an observability service. The telemetry pipeline uses tail-based selection: failed runs are retained, while successful runs are sampled. This preserves the failure signals that matter most while keeping normal-traffic volume under control.
Metrics are produced from the same recorded runs, so they reflect the routes selected for tracing rather than every request.
Logging in a route
Use Console Log or Cloud Logs blocks for a visual route, or call the JavaScript logger when a message belongs next to code:
logger.logInfo("Customer lookup completed", { customerId: input.id });
logger.logWarn("Customer service returned a fallback result");
logger.logError("Customer lookup failed", error);
For the full JavaScript logging API, see the JavaScript API Reference.